
Complex systems are difficult to improve because most of their important dynamics remain invisible. Teams see tasks, leaders see metrics, and stakeholders see results—but few people see the relationships connecting them all. System Cartography addresses this challenge by making those connections visible. Through mapping, abstract interactions become understandable structures. What once felt chaotic begins to reveal patterns, pathways, and points of influence. When you can see the system clearly, you can navigate it more effectively.
Invisible Connections Create Visible Results
Organizations often focus on outcomes without understanding the network of interactions producing them. A delayed project may appear to be a scheduling problem when the real issue is a communication bottleneck. Declining engagement may seem like an audience problem when it actually stems from inconsistent messaging. Because systems operate through relationships, their effects are often felt far from their causes. Without a map, people make decisions based on fragments rather than the whole landscape.
The result is predictable: solutions address symptoms while deeper structural issues remain untouched.
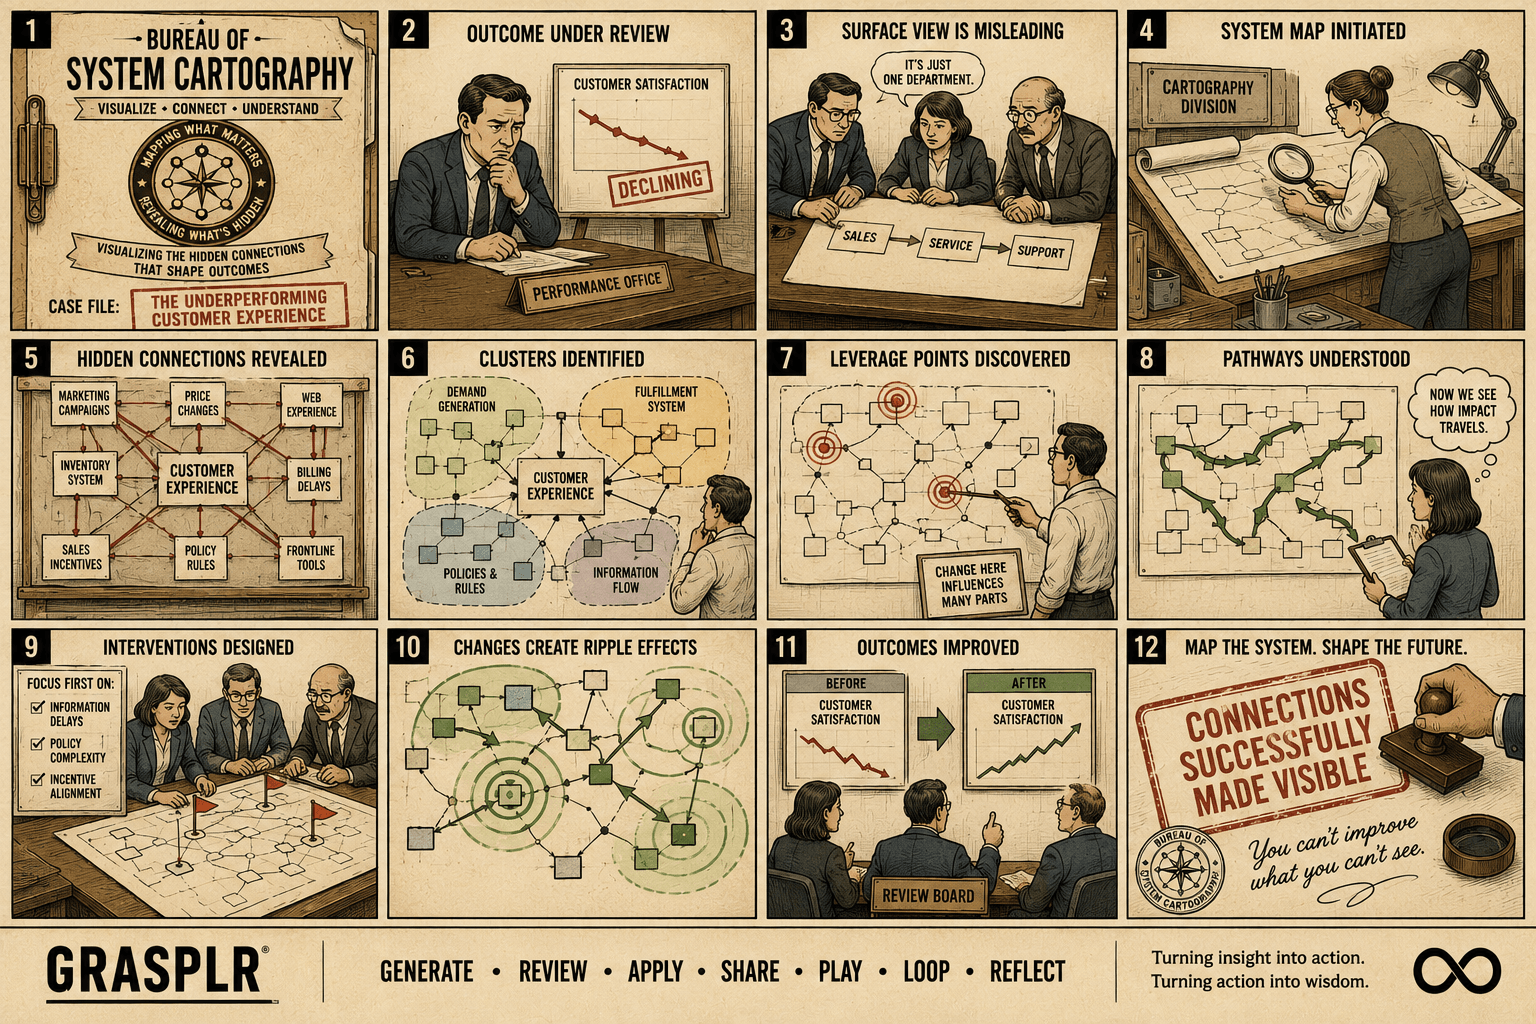
System Cartography and Relationship Visibility
System Cartography is the practice of mapping the components, connections, and flows within a system to reveal how outcomes emerge. Rather than viewing elements in isolation, it visualizes the pathways through which information, resources, decisions, and influence travel.
Every map tells a story about movement. It shows where activity originates, where it accumulates, where it encounters resistance, and where it creates momentum. Some connections strengthen the system through reinforcement. Others introduce friction, delay, or distortion. By making these pathways visible, system maps transform complexity into something that can be studied, discussed, and improved.
The goal is not to create a perfect representation of reality. It is to expose enough structure that meaningful patterns become visible.
Mapping the Flows That Matter Most
Effective system maps focus on relationships rather than inventories. Start by identifying:
- Core Elements: The people, processes, resources, or functions that play significant roles within the system.
- Connection Paths: The routes through which information, responsibility, decisions, or value move between elements.
- Influence Loops: The feedback mechanisms that reinforce behaviors or balance activity over time.
As the map develops, pay attention to recurring pathways. These often reveal leverage points where small changes can create disproportionately large effects. A well-designed map highlights not only what exists, but how everything interacts.
Better Maps Lead to Better Interventions
Most failed improvements stem from incomplete understanding. When leaders cannot see the system, they rely on assumptions. System Cartography replaces assumptions with visibility. It reveals where energy is wasted, where momentum is generated, and where change will have the greatest impact.
The most effective practitioners do not use maps merely to document complexity—they use them to navigate it. By visualizing the hidden connections behind every outcome, they gain the ability to influence systems with greater precision and confidence. In the end, the quality of your decisions is often limited by the quality of the map guiding them.